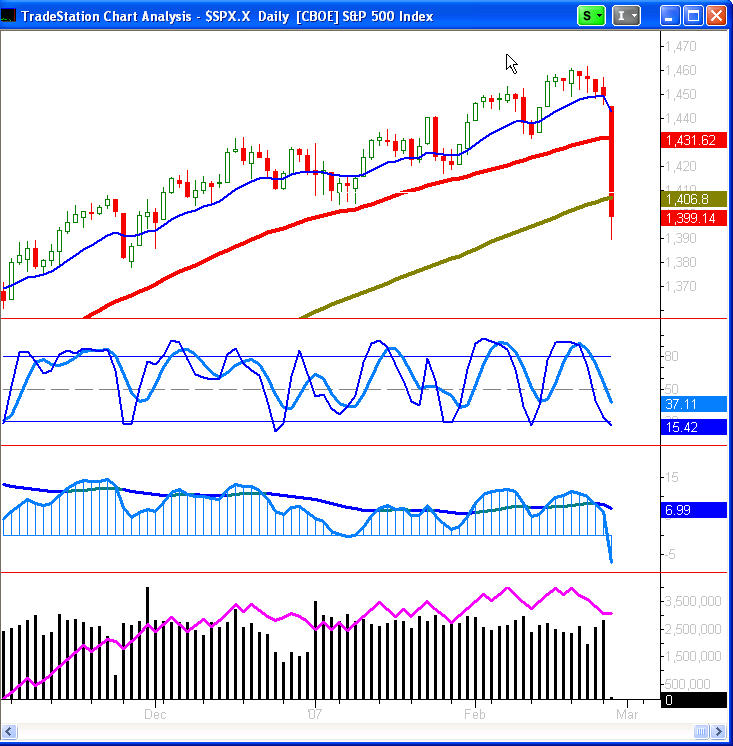
 Today was the worst sell-off in the stock market in many years. At one point the DOW was down over 500 points!
Is this a disaster?
I don’t think it’s necessarily a disaster. Compare other times on the chart when the market had similar “falling off a cliff” days and it should ease your mind.
Was there any warning?
Nothing predicts or forecasts what the market will do in the future, but there were 2 markets that may have given a bit of a warning. I traded both of these markets to the long side, and it’s worked out quite well.
—
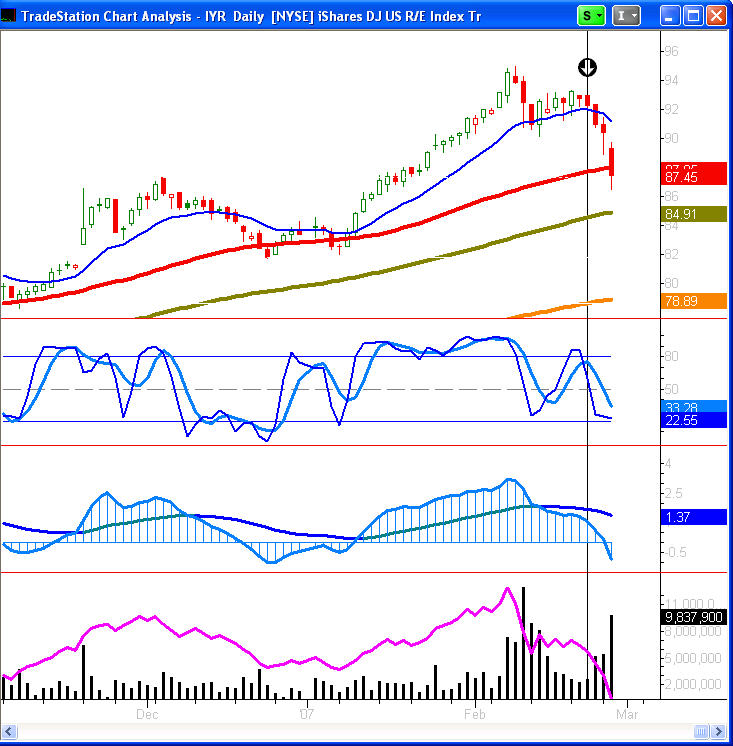
 The first market is REAL ESTATE. Everyone’s been waiting for the “bubble” to burst. Multitudes of people used creative financing to get into houses they otherwise couldn’t afford. But low interest rates have prevented those people from getting hurt.
While being tempted to short this market, there simply haven’t been any good shorting opportunities from a technical analysis point of view … until last week. The iShares for the Dow Jones US Real Estate Trust finally put in a potential shorting pattern ahead of the major stock indexes. See the chart to the left.
—
—
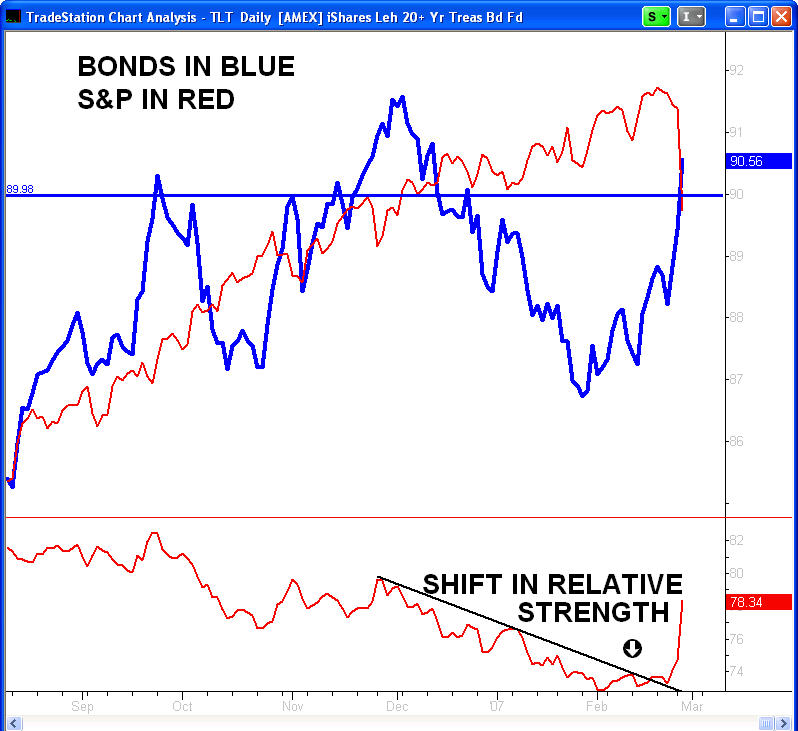
 And then there is the BOND MARKET. In a previous Blog entry (February 6, 2007) I demonstrated the Relative Strength measurement that can be used to compare 2 markets (not to be confused with the “RSI” indicator.
In a recent Video Newsletter, I showed how the Bonds and the S&P were beginning to shift (the Bonds picking up strength in relation to the S&P.
This week we see the further result of that first clue!
The S&P 500 dropped like a brick and the Bonds have moved up aggressively.

Leave a Reply